Executive summary
- The ABI’s own data has confirmed 2025 as a genuine subsidence event-year: Domestic subsidence payouts reached £307 million, up 10% (£27 million) from 2024, and the highest annual total since the ABI began collecting this data in 2017.1
- ABI data shows that severity, not just frequency, is increasing: The average domestic subsidence claim rose 9% year-on-year to £17,820 in Q1 2026, from £16,295 in Q1 2025.2
- Environmental conditions associated with subsidence risk have persisted in 2026 and have now intensified: The Environment Agency's July 2026 water situation report shows record low rainfall for July and soil moisture deficit (SMD) at levels close to the previous historic maximum.3 Drought was subsequently declared across large parts of England,4 the third such declaration in five years, following declared droughts in 2022 and 2025.5 This confirms that the physical drivers associated with previous subsidence events remain present, whilst indicating a continuation of elevated risk rather than a new escalation beyond 2025.
- Market participants’ commentary now frames 2026 explicitly as a potential fourth subsidence event-year in the last ten years, alongside 2018, 2022 and 2025.6
- For reserving actuaries, the risk environment remains elevated relative to our original assessment: Repeated years of elevated SMD increase uncertainty around claim frequency, severity, development patterns and potential overlap (‘stacking’) of multiple event-year cohorts.
What did we say in October 2025 and what has changed?
In our original paper,7 we outlined some background to and drivers of subsidence claims in the UK. We also pointed to the expectation that the changing climate, particularly more frequent and prolonged periods of drought, will have an impact on the frequency and severity of subsidence claims in the future. Using the Environment Agency's SMD data, we compared conditions in summer 2025 against the known event-years of 2018 and 2022 and concluded that a 2025 subsidence event looked likely, particularly in London and the South-East.
Four characteristics of subsidence claims follow from the conclusions in that paper:
- Environmental indicators, including SMD, will remain a leading proxy for subsidence frequency, particularly in shrink–swell clay regions across southern and central England
- Loss emergence will be highly seasonal, peaking after warm, dry summers and subsequent re-wetting
- Repair cost inflation and contractor availability will increase average claim severity, even where frequency remained stable
- Subsidence will increasingly resemble other UK secondary catastrophe perils—longer settlement tails, greater uncertainty and higher climate sensitivity
Over the first half of 2026, a range of market information relating to subsidence has been published by market players, covering press releases, financial results and industry data. Summer 2026 has seen record heat and dry conditions across England. This paper presents an update to the industry view on the 2025 claims experience and summarises the external subsidence environment looking forward to the 2026 year-end.
What the ABI data now confirms about 2025
The ABI's 2025 year-end data, published in February 2026, support our original conclusion that a subsidence event in 2025 looked likely. Insurers paid out £6.1 billion in property claims across 2025, the highest annual total since ABI records began in 2017, with £1.5 billion settled in Q4 alone.8 Within that total, domestic subsidence payouts rose 10% to £307 million, following the UK's hottest summer on record.
The broader weather-related property claims picture also highlights the significant impact of weather extremes during 2025:
- Weather-related property claims totalled £1.2 billion in 2025, up 14% (£142 million) from 2024
- Domestic flood claims rose 38% to £312 million, with the average flood payout up 60% to £30,000
- Storm damage to homes rose 32% to £244 million, averaging £2,450 per claim
- Insurers settled over 560,000 home claims in total during 2025, with the average claim up 15% year-on-year to £6,000
Signal update: The July 2026 water situation report
The Environment Agency's July 2026 report3 is the most recent full monthly report available at time of writing and gives an early read on the 2026 season. England's July rainfall alone was ranked as exceptionally low across all regions. July marked the start of a much drier third quarter, following a notably dry second quarter: On the Environment Agency's separate three-month cumulative classification (Figure 1), East England's May to July rainfall was classed as exceptionally low, whilst most other regions were classed as notably low. This represented a sharp reversal from an anomalously wet January to March.
Figure 1: Regions scored by May-July 2026 cumulative rainfall classification
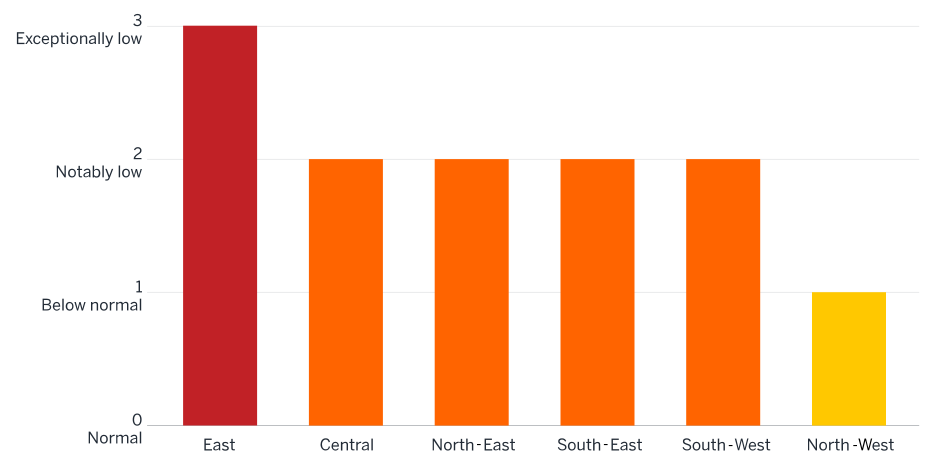
0 = normal, 3 = exceptionally low. East England carries the largest deficit.
Some additional messages from the National Water Situation Report England, July 2026, include:
- SMDs rose through July due to the ongoing hot and dry conditions to be close to the maximum recorded in 1961. Soils were dry across all English regions, with the largest SMD in South-East and East England, and along the Welsh border.
- Central and East England have each recorded five consecutive months of below-average rainfall.
Figure 2: England mean temperatures in May, June and July 2026 compared to the long-term average for the years 1991 to 2020
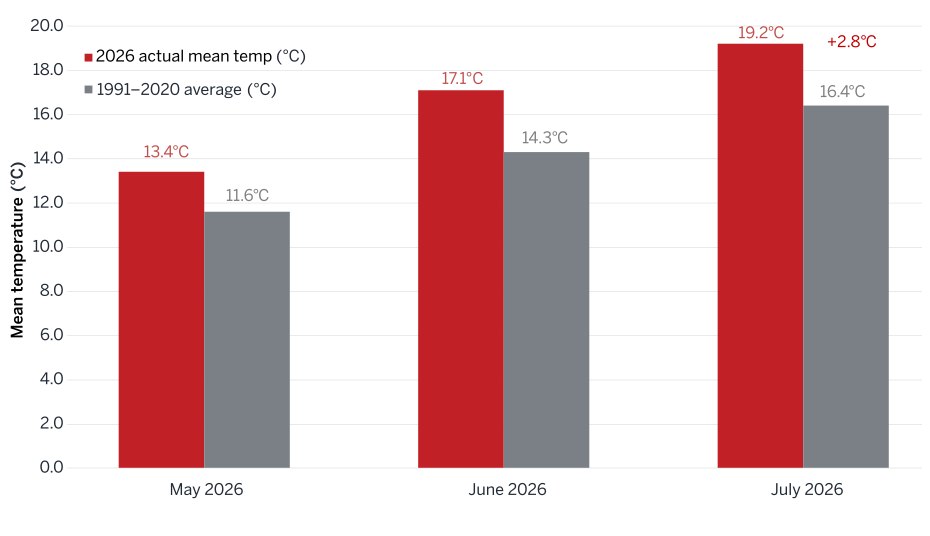
As Figure 2 shows, this rainfall deficit was compounded by sustained above-average temperatures across the same three months rather than occurring in isolation. This combination matters for subsidence risk specifically, as higher temperatures cause soils to lose moisture faster, both through direct evaporation and through plants and trees drawing more water out of the ground. As a result, dry and hot conditions reinforced one another, driving SMD higher than the rainfall shortfall alone would suggest.
These early warning indicators subsequently translated into a more severe hydrological assessment. In July 2026, drought conditions were formally declared across large parts of England following prolonged dry weather, high temperatures and declining water availability.9 This is the third drought declared in England in five years, after 2022 and 2025, meaning that unlike 2018 and 2022, which followed longer drought-free intervals, 2025 and 2026 now represent two consecutive years in which drought has been formally declared. This recurrence is itself informative for reserving purposes, as it suggests that the elevated risk observed in 2025 has persisted into 2026. This is consistent with the broader temperature record: 2025 was confirmed as the UK’s warmest year since records began in 1884,10 and Met Office data now puts summer 2026 on course to surpass it as the warmest summer on record,11 underlining that this is not an isolated dry spell but part of a sustained run of exceptional heat. Although the July 2026 declaration does not necessarily imply a more severe underlying risk than was apparent in 2025, it does indicate that elevated conditions have become more persistent and potentially more frequent. The affected regions overlap with several areas of elevated subsidence exposure, particularly across East and South-East England, where persistent rainfall stress and SMD have continued.
The transition from elevated SMD to formal drought declaration strengthens the case for treating environmental indicators as a leading reserving signal. Although drought status itself does not directly determine subsidence claims, the persistence of dry conditions increases the likelihood of clay shrinkage in vulnerable geographies and therefore raises the probability of elevated claim frequency following subsequent seasonal changes.
The Environment Agency’s July to September outlook points to continued warmer-than-average conditions with a greater-than-normal chance of heatwave, particularly earlier in the period. September is typically close to the peak of the annual subsidence notification cycle, so this forecast window matters directly for the 2026 accident-year frequency.
Market signals: Industry participants flag a possible fourth event-year
Independent claims-handling commentary published in July 2026 lines up with the environmental data. Claims Consortium Group noted that 2026 conditions are already resembling those that preceded the 2025 event-year, with SMD and prolonged dry conditions pointing to a potential fourth event-year in the last ten years (after 2018, 2022 and 2025).12 The Group also warned that repeated event-years may lead insurers to reconsider their underwriting approach for properties exposed to subsidence risk.13 Similar concerns have been raised by other market participants, including Ecclesiastical, NFU Mutual and Prestige Underwriting, as dry conditions persist.14
This is unfolding as UK home insurers face increasing pressure on underwriting profitability. UK home insurance premiums fell 9% year-on-year in January 2026, even as claims hit record levels. Deloitte has forecast a 102.1% combined ratio for UK home insurers in 2026. This means the sector is expected to pay out more in claims and costs than it collects in premium.15 This may encourage insurers to reassess their approach to climate-sensitive perils such as subsidence, placing greater weight on forward-looking climate, soil moisture and exposure indicators alongside historical claims experience.
Reserving implications
Frequency-severity decomposition
Our original paper expected that subsidence losses would increase through both greater frequency of claims and each claim becoming more expensive (severity). The ABI's most recent data16 (Figures 3 and 4) shows both effects moving in the direction we anticipated.
Figure 3 shows the combined effect of frequency and severity: Domestic subsidence payouts reached a record £307 million in 2025,17 up 10% year-on-year, a total that reflects growth in both the number of claims and their average cost.
Figure 3: ABI domestic subsidence payouts by year (£m)
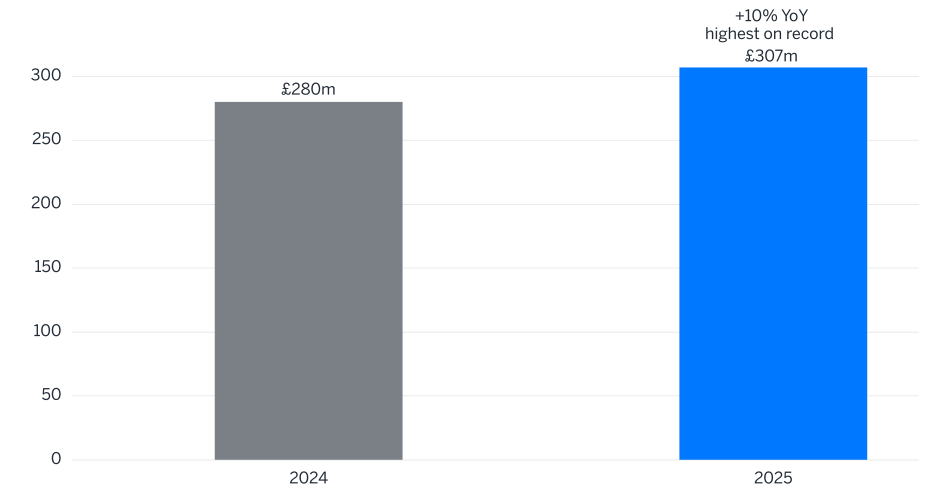
Source: ABI, February 2026.
Figure 4 isolates the severity specifically.
Figure 4: ABI average domestic subsidence claim severity by quarter
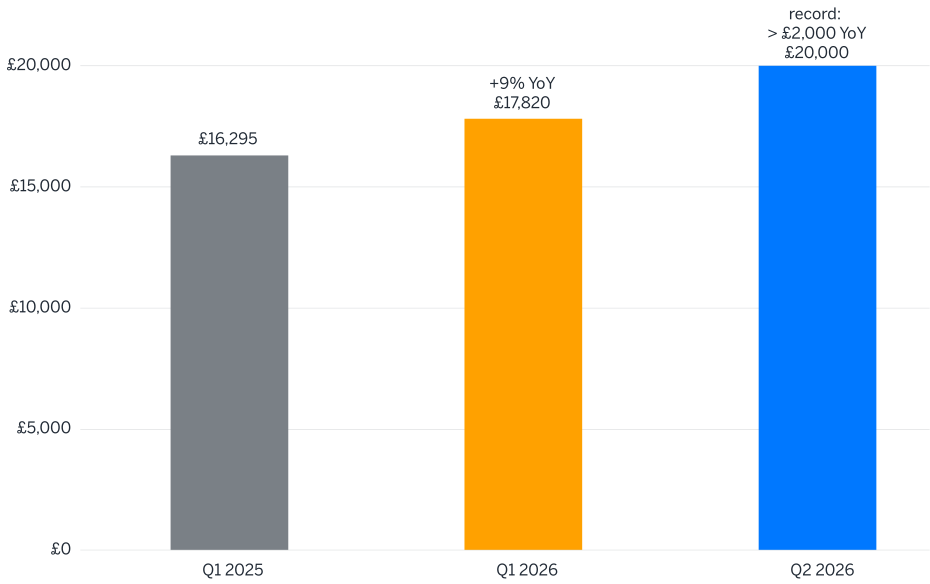
Source: ABI, May 2026 and August 2026.
Severity trend assumptions built solely on historical pre-2025 data are likely to understate current cost per claim. The average subsidence claim rose 9% year-on-year to £17,820 in 2026Q1. It rose by more than 11% year-on-year to a record of £20,000 in 2026Q2, which is three to four times the UK’s headline CPI inflation rate of 2.6% over the same period.18 A gap of this size suggests the driver is specific to subsidence claims (such as repair cost escalation, contractor capacity constraints or a shift toward more severe cases within the claim mix) and points to a need to revisit assumptions underlying claim severity, development patterns and allowances increases in claim severity in the tail.
Frequency assumptions may benefit from incorporating a range of environmental indicators of subsidence claims. This conclusion is consistent with our original recommendation. The subsequent declaration of drought conditions across affected regions provides further evidence that environmental indicators are capturing a meaningful change in underlying subsidence exposure rather than presenting short-term weather volatility alone.
The persistence of dry conditions into a second consecutive year also creates uncertainty around whether historical frequency assumptions, which are typically calibrated using longer periods containing fewer repeated subsidence event-years, remain representative of current claim emergence patterns.
Development patterns and potential claim stacking19
Subsidence claims typically have longer settlement timelines than other household property claims because establishing the cause of damage often requires an engineering investigation, the monitoring of ground movement and an assessment of appropriate repairs. Three areas of potential uncertainty are particularly relevant when assessing subsidence reserves in the current environment:
- Subsidence claims arising from previous dry-weather event-years may not yet have been remedied as new claims emerge. The 2026 notifications could therefore overlap with claims from prior event-years, increasing uncertainty around development patterns and ultimate claims cost. The current conditions increase the likelihood that 2026 event-year claims develop alongside unresolved claims from the 2025 event-year.
- Despite potential ambiguity regarding the timing of the actual ground movement (i.e., event-year) and assuming continuous coverage for a policyholder, the attribution of a claim to a policy year is governed by the date the damage was discovered and the insurer notified. Even for a policyholder who changed insurance provider between the consecutive event-years, the ABI’s Domestic Subsidence/Heave/Landslip ‘Change of Insurer’ Claims Agreement20 clarifies which insurance provider deals with the claim. This underlying framework will be tested during 2026, should consecutive event-years manifest, as will associated data quality standards adhered to by insurance companies and relied on by actuaries implementing actuarial reserving methods.
- Where prior ground movement has not been fully stabilised, or vegetation continues to draw moisture from shrink–swell clays, consecutive dry years may increase the risk that previously settled or reserved claims reopen or deteriorate. This could lead to a stacking effect (Figure 5) that is not well-handled by most standard actuarial reserving methods. Repeated periods of drought-like conditions may therefore challenge the assumption that consecutive subsidence event-years are independent and separated by sufficient recovery periods, increasing uncertainty around tail development and ultimate claims cost.
Figure 5: Illustrative timeline of subsidence claim cohort development
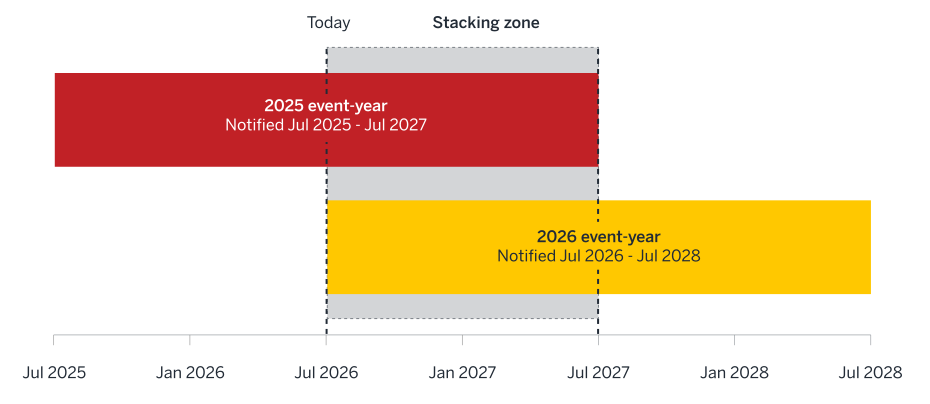
The figure shows potential stacking between the 2025 event-year cohort and a hypothetical 2026 cohort. Dates are illustrative, based on typical subsidence settlement tails of 12 to 24 months; they are not drawn from a specific claim triangle. The 2026 cohort is shown for illustration only. As noted in Section 3, whether 2026 develops into an event-year remains unconfirmed at time of writing.
This environment may warrant greater consideration of event-year segmentation when assessing development assumptions. Separating major drought-related cohorts (for example, 2018, 2022 and potentially 2025/2026) from non-event-years may provide a more appropriate basis for assessing tail development and reserve uncertainty, particularly if recent claims experience continues to diverge from historical averages.
Leading indicators for early-warning reserving
Consistent with our original paper, we continue to recommend that reserving teams track the Environment Agency's monthly water situation reports as a leading indicator ahead of claims notifications. The July 2026 report's21 regional pattern (East and South-East deficits, four consecutive below-average months in Central and East England) is directionally consistent with the early stages of 2018, 2022 and 2025, though the Environment Agency itself cautions that ultimate claims experience depends on conditions through the remainder of summer and autumn.
More broadly, the recurrence of weather-driven subsidence spikes and the clear correlation between soil moisture conditions and claims experience reinforces the view that traditional reserving approaches based solely on historical claims development benefit from being supplemented with external risk indicators. Emerging data sources, including geospatial exposure models22 and climate datasets, provide additional insight into claim emergence and help identify where historical development patterns may no longer be fully representative. These tools are particularly valuable for assessing frequency assumptions, identifying high-risk geographic concentrations and informing assumptions around claims emergence and development.
Conclusion and outlook
The evidence that has been accumulated since the publication of our original paper broadly confirms its key conclusions. UK subsidence is impacted by changes in both claim frequency and severity, with frequency influenced by climatic conditions and severity subject to inflationary pressures. It should therefore be considered as a secondary catastrophe peril. The 2025 experience has validated this assessment, with ABI data confirming that 2025 was a significant subsidence event-year, characterised by both elevated claim frequency and increasing severity. Similarly, we see strong evidence that 2026 will lead to another subsidence event-year, with persistent SMDs, the declaration of drought conditions across affected regions and continued industry commentary, all indicating that the environmental conditions are consistent with previous event-years.
It remains too early to confirm 2026 as a fourth subsidence event-year from the last ten years, as the real test will be subsidence claim emergence. The emergence of another wave of subsidence claims will depend on the conditions experienced throughout the remainder of the summer and the autumn re-wetting. The key uncertainty has therefore shifted from whether adverse environmental conditions exist to how strongly they translate into claim frequency, severity and development patterns.
For reserving actuaries, the findings reinforce the need to treat 2026 as an elevated-risk cohort and to consider whether historical development patterns remain appropriate in a more volatile climate environment.
1 Adverse weather pushes property insurance payouts to £6.1 billion in 2025 [Press release]. (2026, February 17). ABI. Retrieved August 13, 2026, from https://www.abi.org.uk/media-hub/news-post/adverse-weather-pushes-property-insurance-payouts-to-61-billion-in-2025.
2 Home insurers pay out £846 million to support households. (2026, May 6). ABI. Retrieved August 13, 2026, from https://www.abi.org.uk/media-hub/news-post/home-insurers-pay-out-846-million-to-support-households.
3 Monthly water situation report England. (n.d.). Environment Agency. Retrieved August 13, 2026, from https://assets.publishing.service.gov.uk/media/6a7afa13bbafcd1db3b6e3dd/National_Water_Situation_Report_England_July_2026.pdf.
4 Drought: How it is managed in England. (2026, April 8). Environment Agency. Retrieved August 13, 2026, from https://www.gov.uk/government/publications/drought-management-for-england/drought-how-it-is-managed-in-england.
5 Department for Environment, Food & Rural Affairs, Environment Agency, & Hardy, E. (2026, July 29). Drought Declared in half of England [Press release]. Gov.uk. Retrieved August 13, 2026, from https://www.gov.uk/government/news/drought-declared-in-half-of-england.
6 Rosanes, M. (2026, July 6). Weather claims reshape UK loss adjusting as property payouts hit record. Insurance Business. Retrieved August 13 2026, from https://www.insurancebusinessmag.com/uk/news/catastrophe/weather-claims-reshape-uk-loss-adjusting-as-property-payouts-hit-record-581345.aspx.
7 Courchene, J., & Flack, J. (2025, October 29). Will the UK property insurance market experience a subsidence event during 2025? Milliman. Retrieved August 13, 2026, from https://uk.milliman.com/en-GB/insight/uk-property-insurance-subsidence-event-2025.
8 Adverse weather pushes property insurance payouts to £6.1 billion in 2025 [Press release]. (2026, February 17). ABI. Retrieved August 13, 2026, from https://www.abi.org.uk/media-hub/news-post/adverse-weather-pushes-property-insurance-payouts-to-61-billion-in-2025.
9 Department for Environment, Food & Rural Affairs, Environment Agency, & Hardy, E. (2026, July 29). Drought Declared in half of England [Press release]. Gov.uk. Retrieved August 13, from https://www.gov.uk/government/news/drought-declared-in-half-of-england.
10 King, S. (2026, January 2). Double record-breaking year for UK as 2025 confirmed as warmest and sunniest on record. BBC. Retrieved August 13, 2026, from https://www.bbc.com/weather/articles/c306gpyll19o.
11 Warmest UK summer on record “increasingly likely” as temperatures stay well above average. (2026, August 11). Met Office. Retrieved August 13, 2026, from https://www.metoffice.gov.uk/blog/2026/warmest-uk-summer-on-record-increasingly-likely-as-temperatures-stay-well-above-average.
12 Reading the ground: What the data is telling us about summer 2026. (2026, June 22). Claims Consortium Group. Retrieved August 13, 2026, from https://www.claimsconsortiumgroup.co.uk/2026/06/22/reading-the-ground-before-the-claims-arrive-what-the-data-is-telling-us-about-summer-2026/.
13 Garlick, B. (2026, May 28). UK heatwave is changing how insurers assess subsidence risk. Insurance Business. Retrieved August 13, 2026, from https://www.insurancebusinessmag.com/uk/news/property-insurance/uk-heatwave-is-changing-how-insurers-assess-subsidence-risk-576916.aspx?utm_source=chatgpt.com.
14 Recamara, J. (2026, July 19). Third heatwave of 2026 renews subsidence and wildfire risk warnings for insurers. Insurance Business. Retrieved August 13, 2026, from https://www.insurancebusinessmag.com/uk/news/catastrophe/third-heatwave-of-2026-renews-subsidence-and-wildfire-risk-warnings-for-insurers-582853.aspx.
15 Rosanes, M. (2026, July 6). Weather claims reshape UK loss adjusting as property payouts hit record. Insurance Business. Retrieved August 13, 2026, from https://www.insurancebusinessmag.com/uk/news/catastrophe/weather-claims-reshape-uk-loss-adjusting-as-property-payouts-hit-record-581345.aspx.
16 Average claim for subsidence reaches £20,000 amidst hot weather. (2026, August 3). ABI. Retrieved August 13, 2026, from https://www.abi.org.uk/media-hub/news-post/average-claim-for-subsidence-reaches-record-20000-amidst-hot-weather.
17 Adverse weather pushes property insurance payouts to £6.1 billion in 2025. (2026, February 17). ABI. Retrieved August 13, 2026, from https://www.abi.org.uk/media-hub/news-post/adverse-weather-pushes-property-insurance-payouts-to-61-billion-in-2025.
18 Consumer price inflation, UK: June 2026. (2026, July 22). Office for National Statistics. Retrieved August 13, 2026, from https://www.ons.gov.uk/economy/inflationandpriceindices/bulletins/consumerpriceinflation/june2026.
19 By “stacking,” we mean overlapping development of multiple climate-driven cohorts, where claims from earlier events remain unresolved as subsequent event-years emerge.
20 Domestic subsidence/heave/landslip “change of insurer” claims agreement. (2017, May; Guidelines Q&A updated 2017, December). ABI. Retrieved August 13, 2026, from https://keystone-cms-production-amfyhhecavg8gneq.northeurope-01.azurewebsites.net/blob/keystoneproduction/publicFile/2026/04/abi-domestic-subsidence-claims-agreement-guidelines-december2017-cmo2wnhrk01trgaok0wkpf3su.pdf.
21 Monthly water situation report: England. (n.d.). Environment Agency. Retrieved August 13, 2026, from https://assets.publishing.service.gov.uk/media/6a7afa13bbafcd1db3b6e3dd/National_Water_Situation_Report_England_July_2026.pdf.
22 Wallens, J., & Proctor, E. (2025, August 28). How geospatial data is becoming a crucial part of risk analysis: What this means for insurers. Browne Jacobson. Retrieved August 13, 2026, from https://www.brownejacobson.com/insights/the-word-august-2025/how-geospatial-data-is-becoming-a-crucial-part-of-risk-analysis.