Introduction: The 2008 global financial crisis and qualified mortgages
Following the 2008 global financial crisis (GFC), the volume of repurchases by mortgage issuers for representations and warranties (R&W) increased exponentially. R&W agreements require the issuer of mortgages to repurchase the loans or otherwise make whole the investors in a mortgage if the loans are found to breach the seller guidelines or misstate key attributes relied upon for underwriting the mortgage. For example, a lender might be required to repurchase a mortgage if the documentation of the loan listed the borrower’s debt-to-income ratio at 36%, but a re-underwrite of the mortgage identified the actual debt-to-income ratio at the time of underwrite as 50%.
Many banks and nonbanks had not fully accounted for this risk on their balance sheets as historically there had been few R&W requests from investors. In the aftermath to the GFC, the mortgage industry tightened underwriting for mortgage originations by increasing the level of documentation and verification of data relied upon for mortgages. Government-sponsored enterprises (GSEs) such as Fannie Mae and Freddie Mac have kept a watchful eye on lenders and introduced provisions to evaluate and manage R&W exposure. In 2014, the Consumer Financial Protection Bureau (CFPB) issued regulations to provide safer and more sustainable home loans for consumers, known as Qualified Mortgages (QMs). These new standards are designed to normalize the types of mortgages and/or limit the risk of mortgages acquired by Fannie Mae and Freddie Mac.
As a result of these efforts, R&W exposure has decreased since 2008, and repurchase rates have declined to levels below those experienced prior to the GFC. Figure 1 depicts the percentage of Fannie Mae single-family loans that resulted in repurchase organized by origination year. It is evident that mortgages originated in 2007 and 2008 have exhibited a higher repurchase rate to date, while vintages following the crisis have had a lower percentage of loans repurchased. However, we see that recent vintage years—particularly 2018, 2019, and 2020—portray an increased ramp-up of repurchase activity compared to the vintages immediately preceding them. Originations made in 2020 already have a 0.11% repurchase rate, which is similar to the 2009 vintage. The big difference is that there is an additional 11 years of seasoning with the 2009 vintage, suggesting that repurchase activity may be ramping up.
Figure 1: Fannie Mae single-family loan performance data, % repurchase of original UPB as of March 31, 2022
QM vs. non-QM loans: What defines a non-qualified mortgage?
Simply put, a Qualified Mortgage (QM) means the lender has met certain requirements set by the CFPB and it is assumed that the lender followed the Ability-To-Repay (ATR) Rule. Non-QMs do not meet at least one of the requirements and are not guaranteed by a federal agency, either Fannie or Freddie, or insured by the Federal Housing Administration (FHA), Veterans Affairs (VA), or the U.S. Department of Agriculture (USDA). The most common loan features that do not satisfy these requirements are: limited documentation, a debt-to-income (DTI) ratio greater than 43%, interest-only periods, and terms greater than 360 months. Types of non-QM products being originated today include: debt service coverage ratio (DSCR) loans, where loans are underwritten based on cash flow generated from investment properties rather than a borrower’s personal income; bank statement loans, where loans are granted with bank statement records rather than W-2s like traditional QM loans; and fix and flip loans, which are short-term credits to help real estate investors purchase properties in order to renovate and sell the homes at a profit. Non-QM loans are particularly appealing for borrowers who are self-employed, have a high net worth, are investing in multiple rental units, have recent bad credit, or who are foreign nationals.
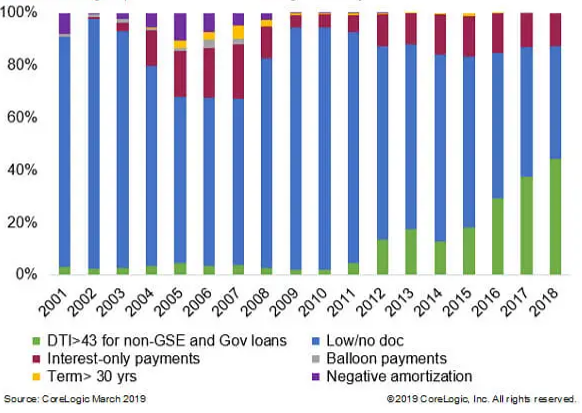
Figure 2 compares the non-QM equivalent loans from 2001 to 2018 by composition of six key risk features. All conventional home-purchase loans not meeting at least one of these six QM-mandated criteria were included.
Figure 2: Loans exceeding 43% DTI threshold rising in recent years

What is sparking the growth of the non-QM market?
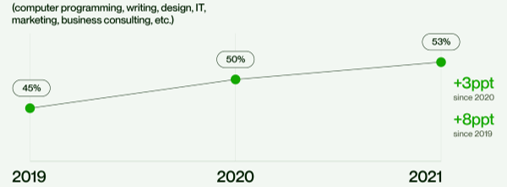
While it is difficult to accurately measure the volume of the non-QM market, there are several reasons to believe it will see significant growth in the coming years; with some speculating non-QM volume could reach $100 billion in 2022.1 Many originators have relied on the recent unprecedented low mortgage rates to generate refinance transactions, fueling their loan production and profitability. As interest rates have increased in the recent months, and are expected to continue to increase, lenders will look to tap other markets to fill the void left by the refinance wave. Figure 3 shows the 30-year fixed mortgage rate trends as reported by Freddie Mac.2 As a natural alternative, the non-QM market provides lenders with an avenue to boost production instead of turning to a pricey purchase market execution. Another trend that is expanding the non-QM market is the increase in self-employment, particularly freelance workers, among the highly skilled and educated. Figure 4 shows the increasing trend of freelance workers since 2019.3 These borrowers typically do not have the traditional documentation available to satisfy the requirements of a QM loan. Further, the Federal Housing Finance Agency (FHFA) recently raised fees on high-balance mortgage loans and second home deliveries to Fannie Mae and Freddie Mac. This action will entice lenders to consider pricing across all markets, including the non-QM market, for loans with these features.
Figure 3: Freddie Mac: Primary mortgage market survey, 30-Year fixed mortgage rates
Figure 4: Percentage of freelancers providing skilled services/labor

Source: Upwork - Freelance Forward Economist Report 2021
Non-QM characteristic impacts on repurchase rates
How do repurchase rates play into the anticipated growth in the non-QM market? To demonstrate how an increase in non-QM loan originations could result in higher R&W exposure for the mortgage market overall, we modeled two sample loans using Milliman’s proprietary mortgage default and repurchase models to measure the overall loan performance for each sample loan.
Milliman’s proprietary default and repurchase models use econometric modeling to develop dynamic estimates that are used by clients in multiple ways, including: analyzing, monitoring, and ranking the credit quality of new production, allocating servicing sources, and developing underwriting guidelines and pricing. The default and repurchase models produce a lifetime default and repurchase rate estimate, respectively, at the loan level. Both models are constructed by combining three important components of mortgage risk: borrower credit quality, underwriting characteristics of the mortgage, and the economic environment presented to the mortgage.
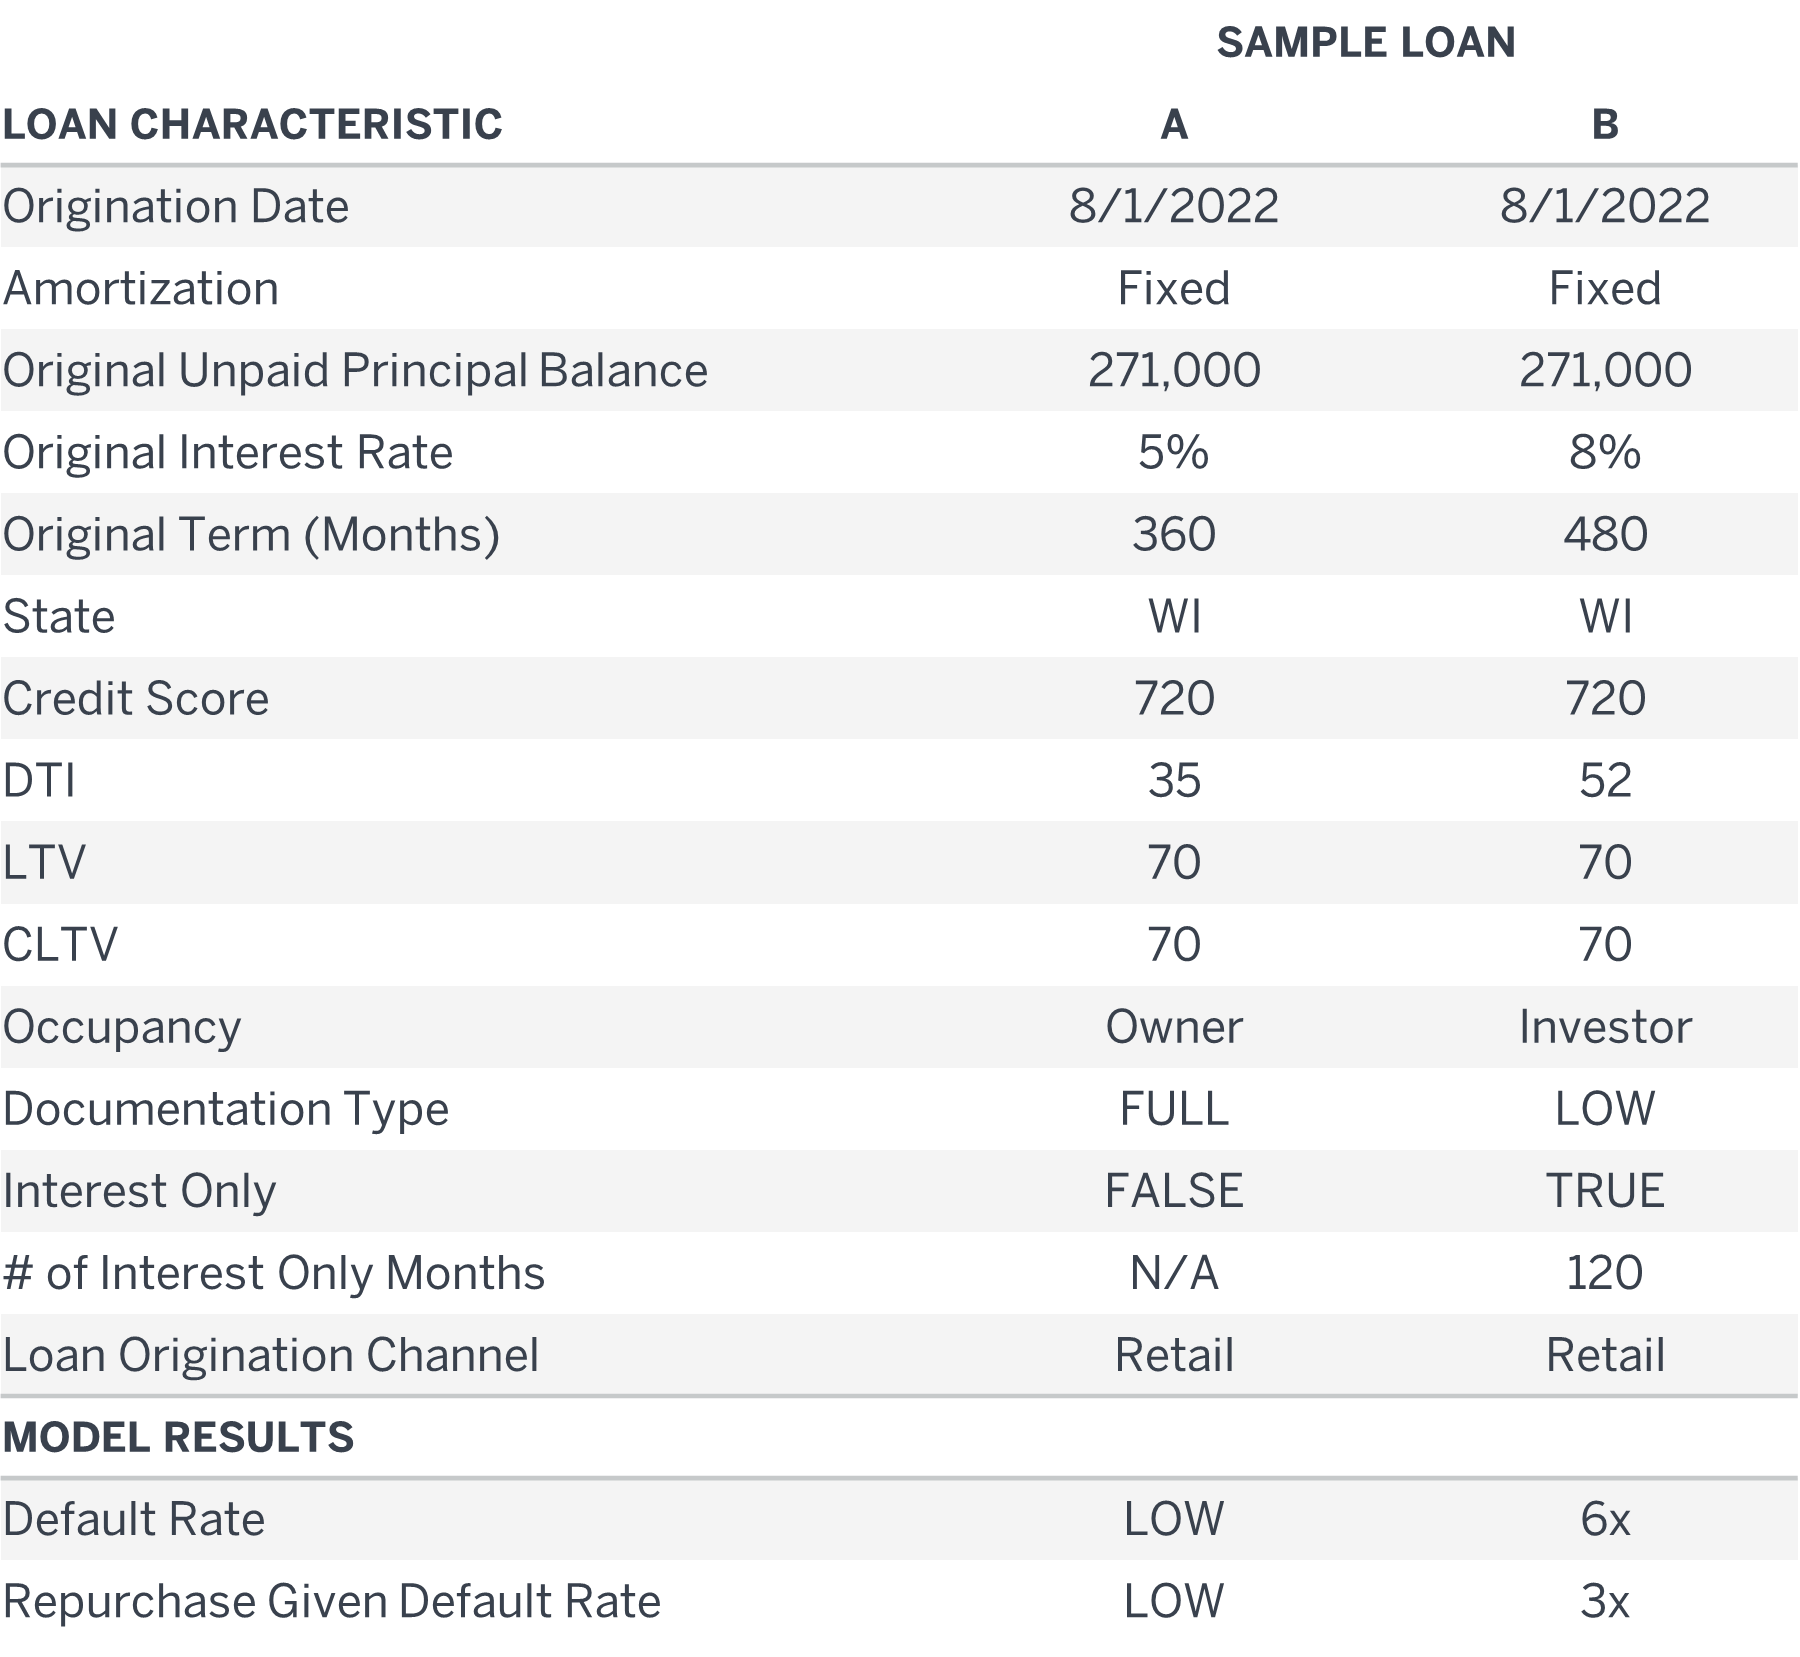
The first of the two sample loans we modeled is labeled as Loan A in Figure 5, which serves as our baseline loan. This baseline loan has the standard characteristics generally found in a qualified mortgage. In comparison, the second loan, Loan B, has the common characteristics of a non-QM.4 Figure 5 summarizes these loan characteristics.
Figure 5: Loan characteristics

Figure 6: Future default percentage, sample loans A and B
Figure 7: Repurchase given default percentage, sample loans A and B
As shown in the Milliman model results in Figures 6 and 7, the resulting default rate and repurchase given default rate are significantly larger for Loan B. This implies that overall R&W exposure is likely to increase as the non-QM market begins to grow, given the current mortgage market conditions. Mortgage investors and lenders who seek protection from repurchases should look to insurers to cover their exposures.
Other factors impacting the industry, non-QM products, and repurchase rates
How do other factors such as inflation, rising interest rates, and layoffs impact the non-QM market and repurchase rates? Inflation in 2022 jumped to almost 10%, the highest level in 40 years, and the Fed in response delivered the biggest interest rate hike in 28 years.5 Borrowing costs have risen sharply across much of the U.S. economy as a result of the Fed’s hikes, with the average mortgage rate topping 6%, its highest level since before the 2008 global financial crisis, up from just 3% at the start of the year.6 Over the next two years, Fed policy makers are forecasting a much weaker economy than was envisioned in March and are expecting the unemployment rate to increase slightly.
The effect of inflation and rising interest rates causing layoffs
The mortgage industry is currently experiencing massive layoffs or reductions in workforces. As applications for mortgages continue to hit record lows amid higher interest rates bringing the refinance boom to an end, some mortgage companies such as Sprout and First Guaranty have closed their doors and dozens more are laying off thousands of employees such as Better.com and LoanDepot. The hidden impact these layoffs have on repurchases are lenders having less qualified people in-house to manage rebuttals and do so successfully.
Prieston and Associates' data anecdotally demonstrates that the GSEs have increased their reviews of older vintage loans dating back to 2019. Lenders insured through certain underwriters at Lloyd's, London R&W coverage through Prieston and Associates have experienced an increase of over 400% in repurchase and inquiry activity in 2022 compared to 2021. Fannie Mae’s repurchase rebuttal, impasse, and management appeals process has seen increased use by lenders as well. As the refinance market shrinks and lenders move to non-QM production in greater market shares, the very increase in scrutiny coupled with the higher default rate will no doubt cause difficulties in long-term capital retention projections especially for midsize lenders. Recent “scratch and dent” bids on repurchased loans has decreased significantly given the coupon and projected property devaluations. Bids experienced by Prieston and Associates have reduced from 85% to 65% of the outstanding loan balances.
During 2020-2021, historically low interest rates have helped lenders capture greater returns and reduce costs. According to a Freddie Mac analysis of the retail-only lenders’ financial statements, the cost to originate a loan in Q4 2020 averaged approximately $8,600, which is more than $1,200 less expensive when compared with Q1 2019. A net margin of 31% was one of the highest the industry has seen in more than a decade.7 These margins are all but gone. As a result, a repurchase of a loan with a high loan-to-value (LTV) ratio, non-QM or QM, will cost the lender $30,000 to $40,000 in losses for an average loan balance of $325,000, with a diminished ability to offset that loss with production profits. Lenders will need to increase reserves for repurchase losses, further narrowing any net profit margin.
Liquidity in non-QM loans: Is there a repurchase-proof mortgage for 2023?
The recent closures of non-QM lenders are directly related to the liquidity squeeze created by the rise in interest rates and the lower coupons on older-vintage loans. However, as pointed out by Acra Lending, a non-QM lender, interest rates at 7% and up have greater attraction in the secondary market.8 However, these loans are more susceptible to default and scrutiny for defects. One solution to manage the risk of repurchase on such loans is to use third-party companies to outsource the underwriting of non-QM loans. Non-QM loans are more difficult to underwrite given the broader spectrum of loan characteristics and alternatives to standard qualifying criteria. Specialized third-party underwriters, such as Evolve Mortgage Services, carry R&W coverage that provides the lender with a significantly reduced error rate and scratch and dent loss coverage in the event there is an error. As a result, a lender using a specialized third-party underwriter can increase profit while reducing the incidence of repurchase and severity of losses.
Industry-wide spread of buyback assumption of liability
Lenders have reduced costs by using digital applications to create better efficiencies.9 In addition, credit bureaus, appraisal management companies, and verification services all provide lenders with services that decrease their internal operations and costs associated therewith. However, most of these vendors do not assume any liability associated with direct loan repurchase. Errors and omissions (E&O) insurance does not cover these specific losses. Most vender contracts contain limited liability provisions that do not extend to the losses lenders experience as a result of a vendor’s service or software-related error that was the proximate cause of the buyback. Some vendors such as Xactus Data Services obtained such a R&W policy, which directly relates to repurchase losses covering any errors made in their reports. It is recommended that lenders require vendors to obtain some form of liability coverage in today’s environment.
Conclusion
The new normal of higher interest rates, the possibility for increased market scrutiny, and the attractiveness of higher-coupon non-QM liquidity and the commensurate profit margins are a potential minefield with substantial rewards, if the risks are managed prudently. Well trained experienced underwriters, rebuttal process trained employees, backstop insurance coverages, and vendor partners willing to share in the risk will undoubtedly see net margins increase in their overall production. However, as the non-QM market share grows substantially in 2023 through 2024, we believe, some lenders new to this submarket will experience what may very well be an existential event.
This article was written by Leighton Hunley and Judith-Anne Brelih in collaboration with Arthur Prieston and Zach Prieston of Prieston & Associates, LLC.
1 Why lenders should think about non-QM origination now - HousingWire.
2 Freddie Mac. Mortgage Rates. Retrieved October 25, 2022, from https://www.freddiemac.com/pmms.
3 Ozimek, A. Freelance Forward Economist Report. Upwork. Retrieved October 25, 2022, from https://www.upwork.com/research/freelance-forward-2021.
4 Milliman’s models are calibrated to GSE loans and the above example demonstrates features of non-QM loans in today’s environment.
5 Rugaber, C. (June 15, 2022). Fed attacks inflation with its largest rate hike since 1994. AP News. Retrieved October 25, 2022, from https://apnews.com/article/fed-interest-rates-inflation-be1b698e48327d3a33847be25aba3e3d.
7 Freddie Mac (November 2021). Cost to Originate Study: How Digital Offerings Impact Loan Production Costs. Retrieved October 25, 2022, from https://sf.freddiemac.com/content/_assets/resources/pdf/report/cost-to-originate.pdf.
8 Conroy, B. (July 27, 2022). Angel Oak confronts the challenges of market volatility, fast-rising rates. HousingWire. Retrieved October 25, 2022, from https://www.housingwire.com/articles/angel-oak-confronts-the-challenges-of-market-volatility-fast-rising-rates/.


